
데이터 시각화를 위한 파이썬
50,000원
온라인 강좌 길이 약 16시간
난이도 중급
수강 기간 365일
참고자료 7개
스터디 채팅방

<딥러닝 전문가 과정> 질문답변방
26명의 멤버가 함께하고 있습니다.
강좌를 구매하시면 즉시 채팅방에 초대됩니다.

✔ 강의 목표
- 데이터를 시각화하는 능력은 개발자, 연구자, 학생 누구에게나 필수적입니다.
- 이 강의를 통해 여러분들의 자료를 효율적으로 시각화하는 방법에 대해 알 수 있습니다.
✔ 수강 대상
- 파이썬을 다루는 모든 분
- 연구자 및 개발자
- 수준 높은 시각화를 원하시는 분
✔ Introduction
- 우리가 어떤 연구를 하고 어떤 결과를 내든지 결과는 대부분 숫자로 표현됩니다. 그리고 이를 가장 잘 전달할 수 있는 방법은 이 자료를 시각화하는 것입니다.
- 데이터의 특징마다 적당한 그래프가 있고, 다양한 그래프를 그릴 수 있는 능력은 곧 자신이 힘들여 내놓은 결과를 가장 잘 포장하는 방법입니다.
✔ 무엇을 배울까요?
- 이 강의에서는 아주 기초적인 단계에서부터 실제 논문들과 예제들을 만들어보며 다양한 데이터를 적절하게 시각화하는 방법에 대해 배웁니다.
- 간단한 API를 사용하는 방법만 다루지 않고 그래프를 이루는 세부요소들을 원하는 대로 설정하는 방법에 대해 깊이 다룸으로써 수강생들은 데이터만 주어진다면 언제든 원하는 그래프를 그릴 수 있게 강의를 준비했습니다.
- 강의뿐만 아니라 강의자료는 앞으로 여러분들이 중요한 발표자료나 논문에 쓰일 자료들을 만들 때 훌륭한 참고자료로 남을 수 있을 거라 확신합니다.
✔ 강좌 특징
- 이 강의는 총 7개의 챕터로 이루어져 있으며 챕터1은 이 강의의 가장 특징적인 챕터입니다. 이 챕터1에서는 Matplotlib의 다양한 그래프에 모두 적용되는 부분들을 충분히 학습하여 시각화를 하기 위한 튼튼한 뼈대를 만듭니다.
- Matplotlib의 공식 홈페이지의 Matplotlib Anatomy에서 보여주는 모든 부분들을 다루며 나머지 챕터에서 모두 사용할 수 있으므로 다른 강의에서는 배울 수 없는 기초지식을 배웁니다.
- 나머지 챕터2부터 챕터7까지는 실제 다양한 그래프들을 그리는 방법을 배웁니다.
✔ 목차
Chap.1 Matplotlib Anatomy
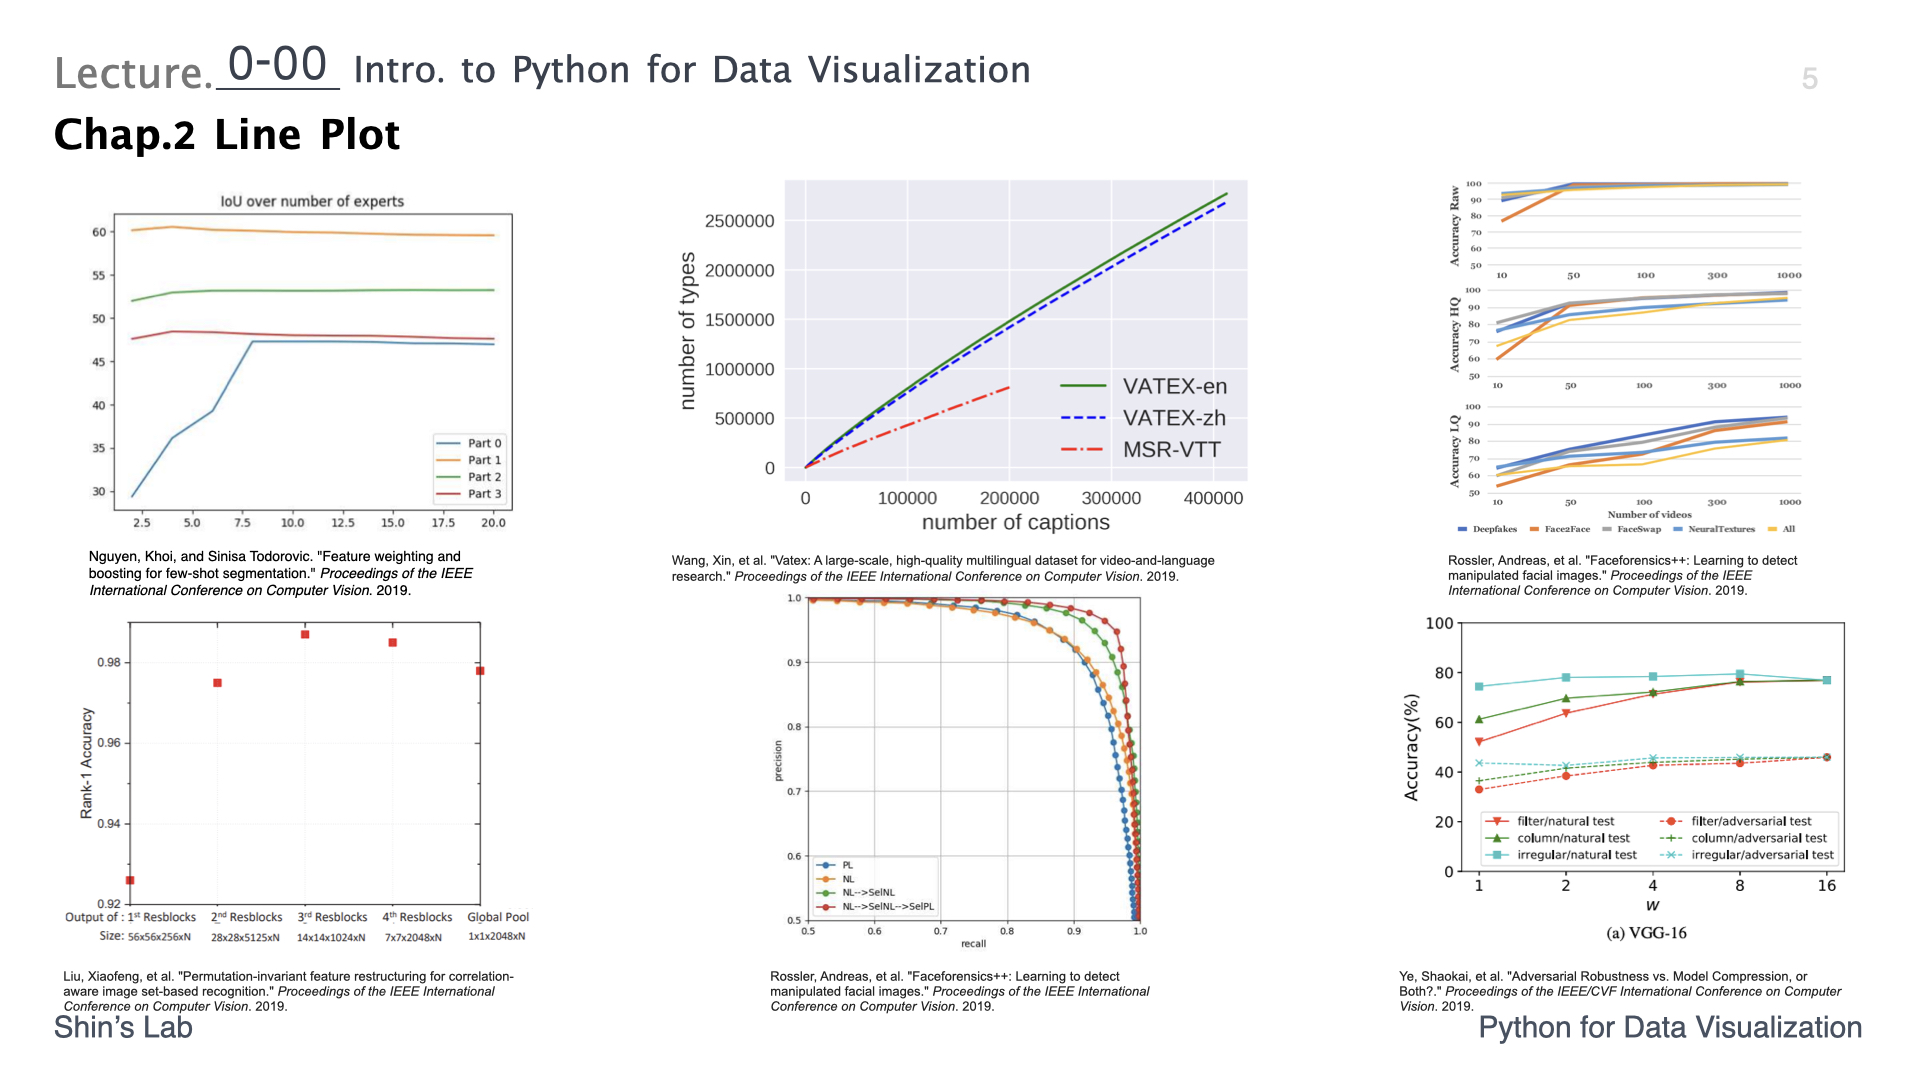
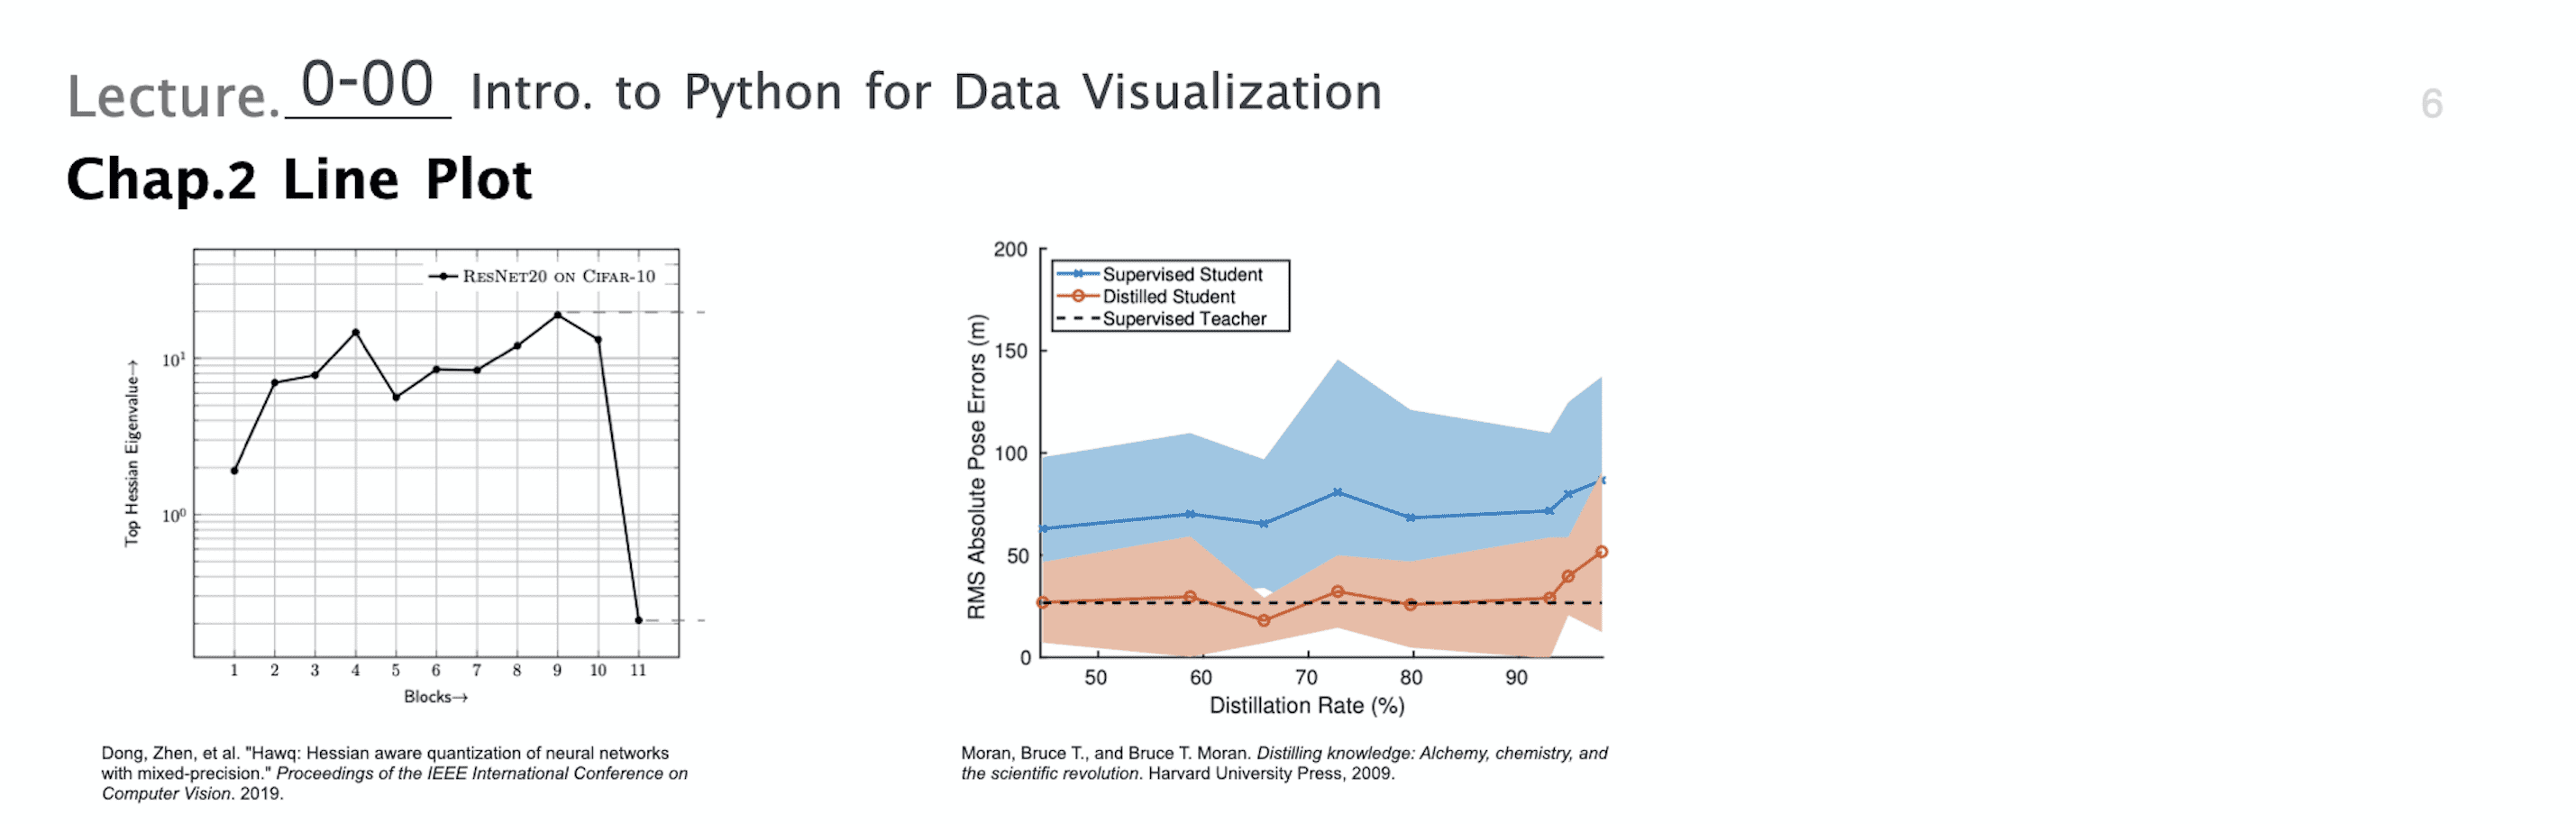
Chap.2 Line Plot
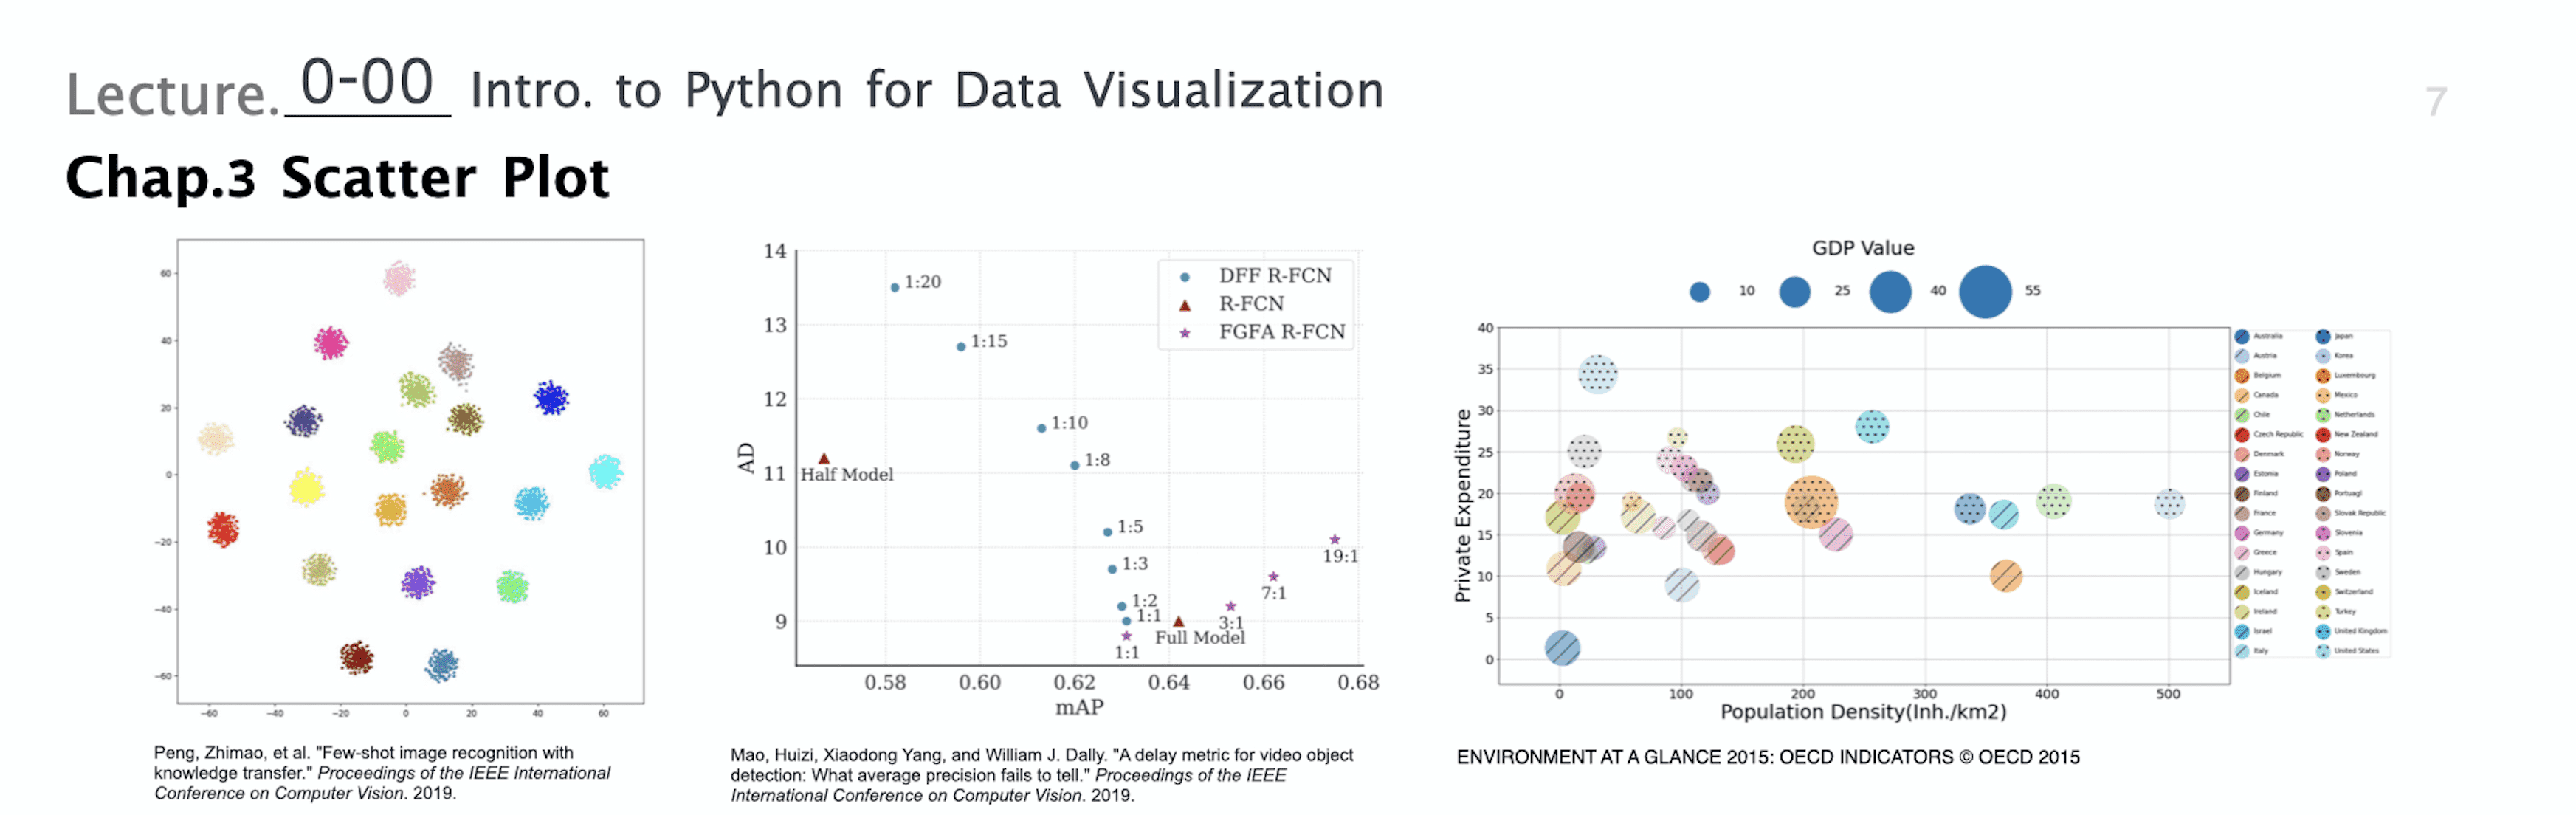
Chap.3 Scatter Plot
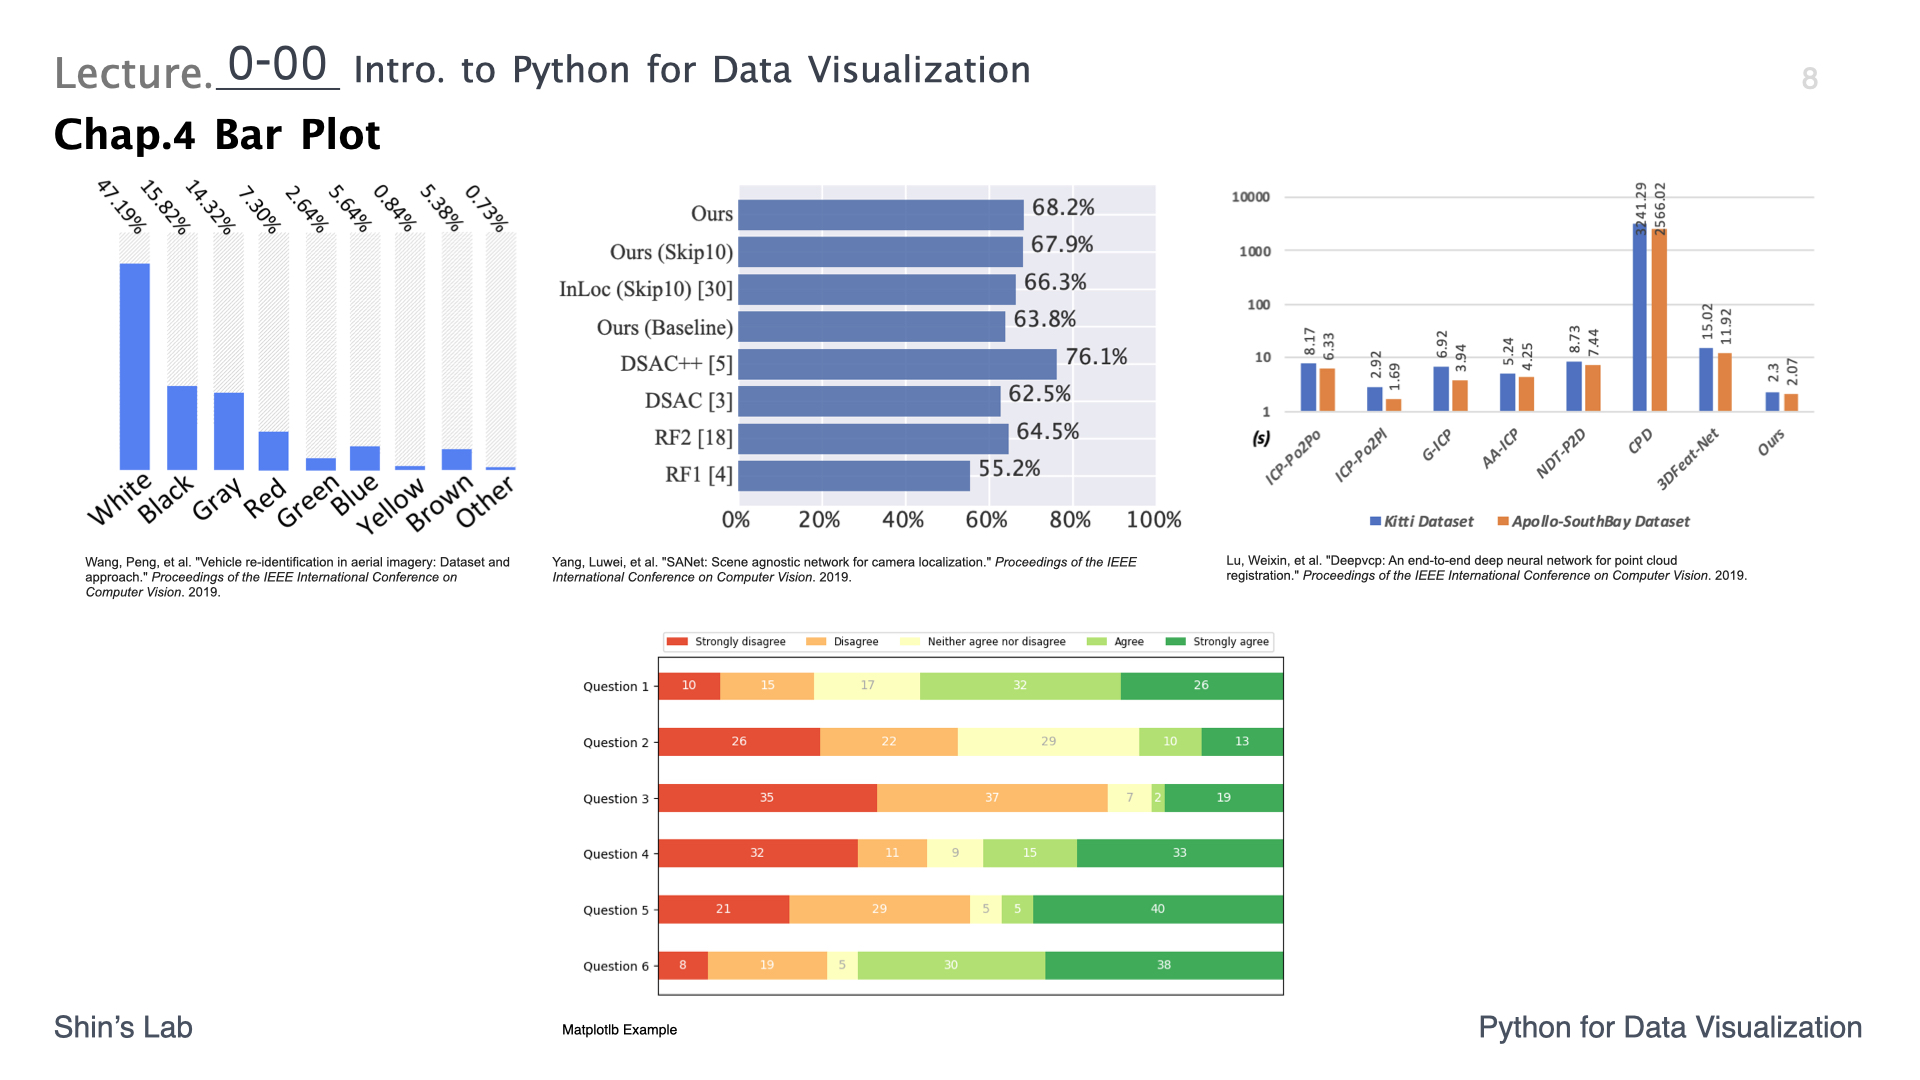
Chap.4 Bar Plot
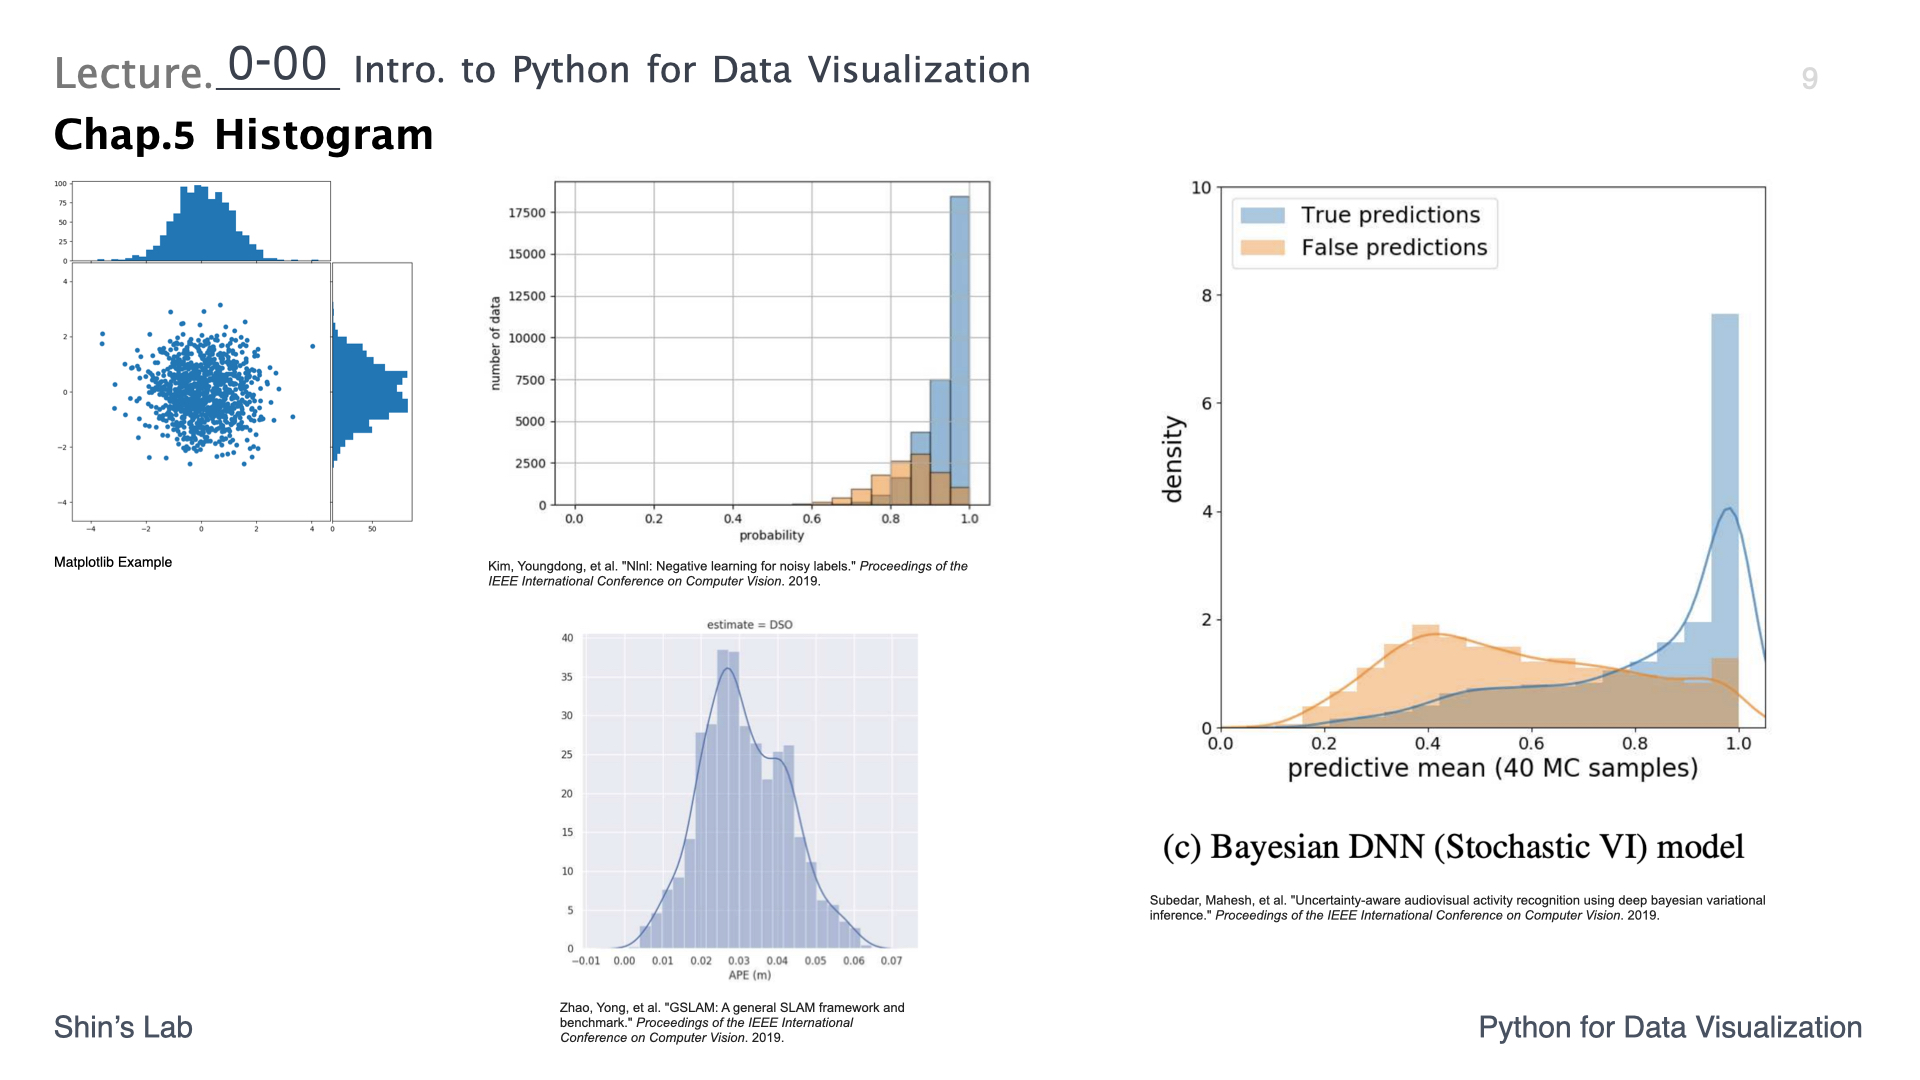
Chap.5 Histogram
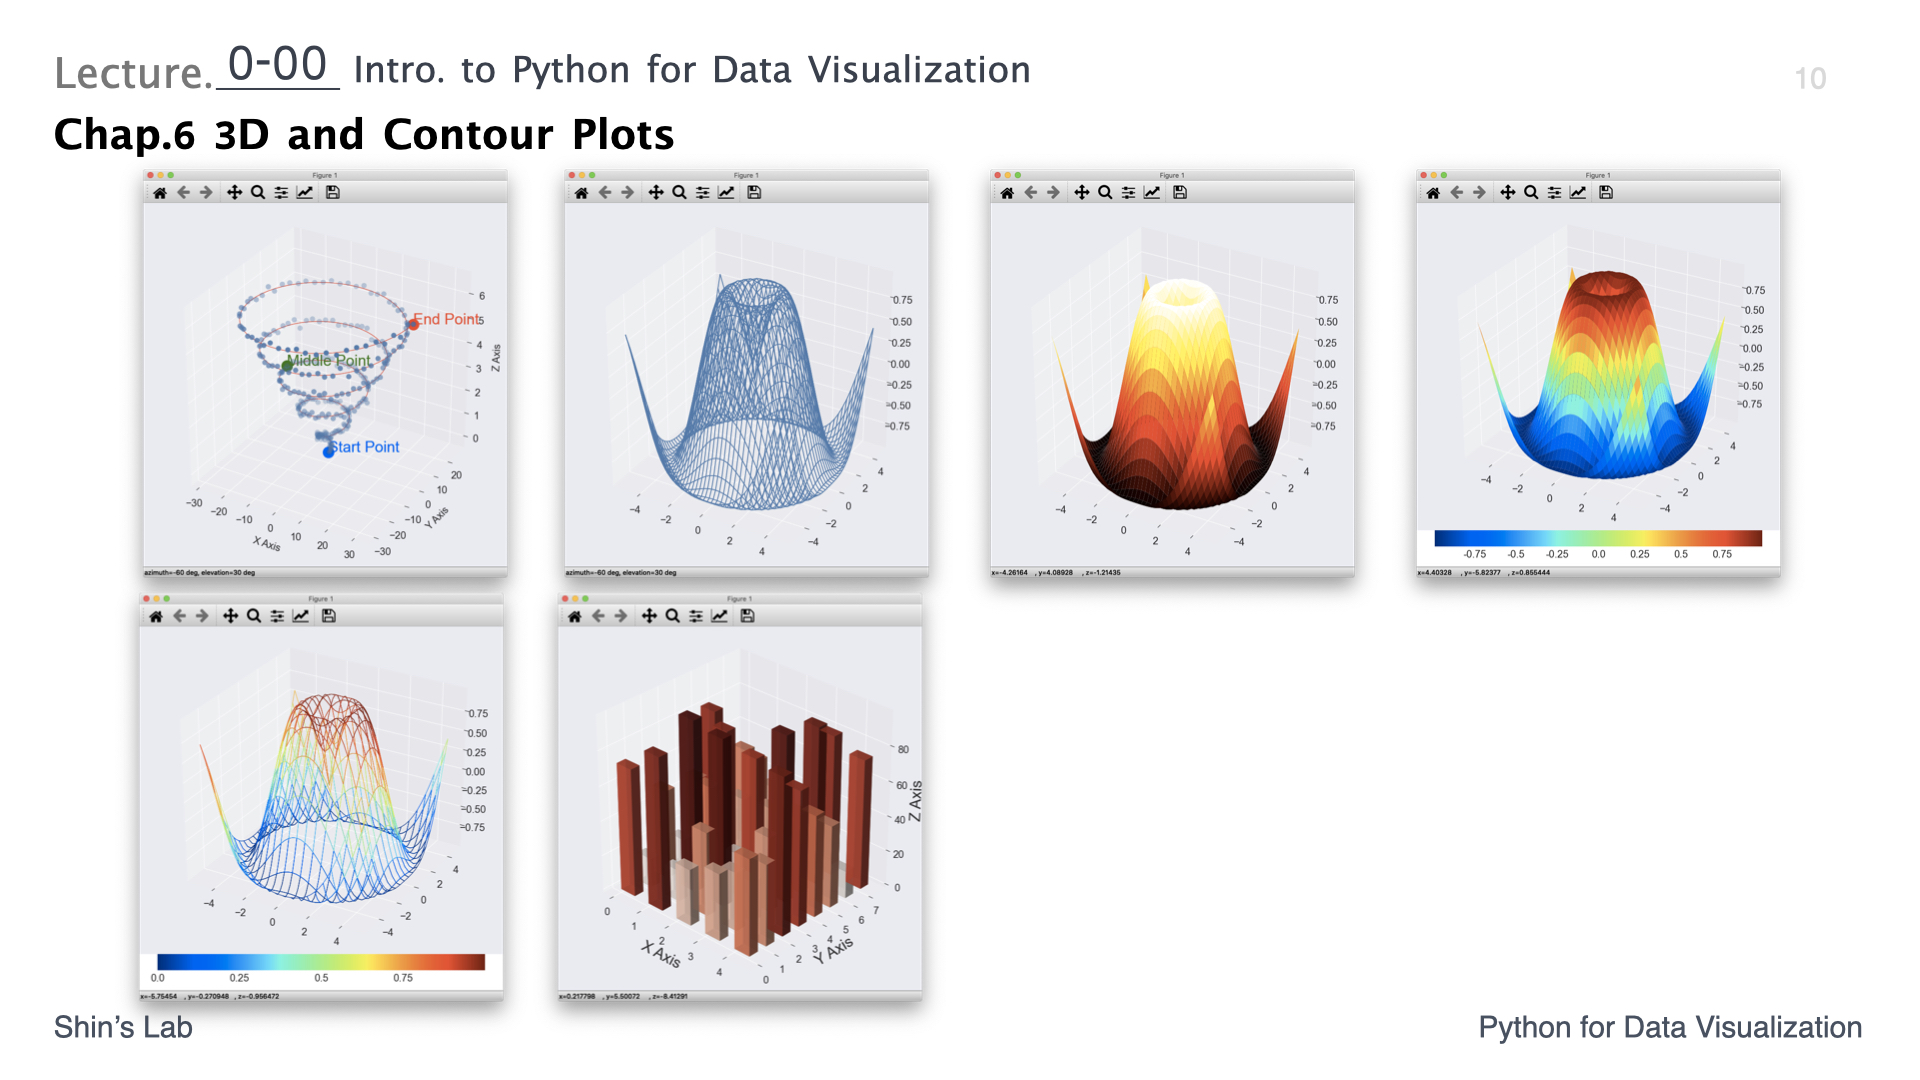
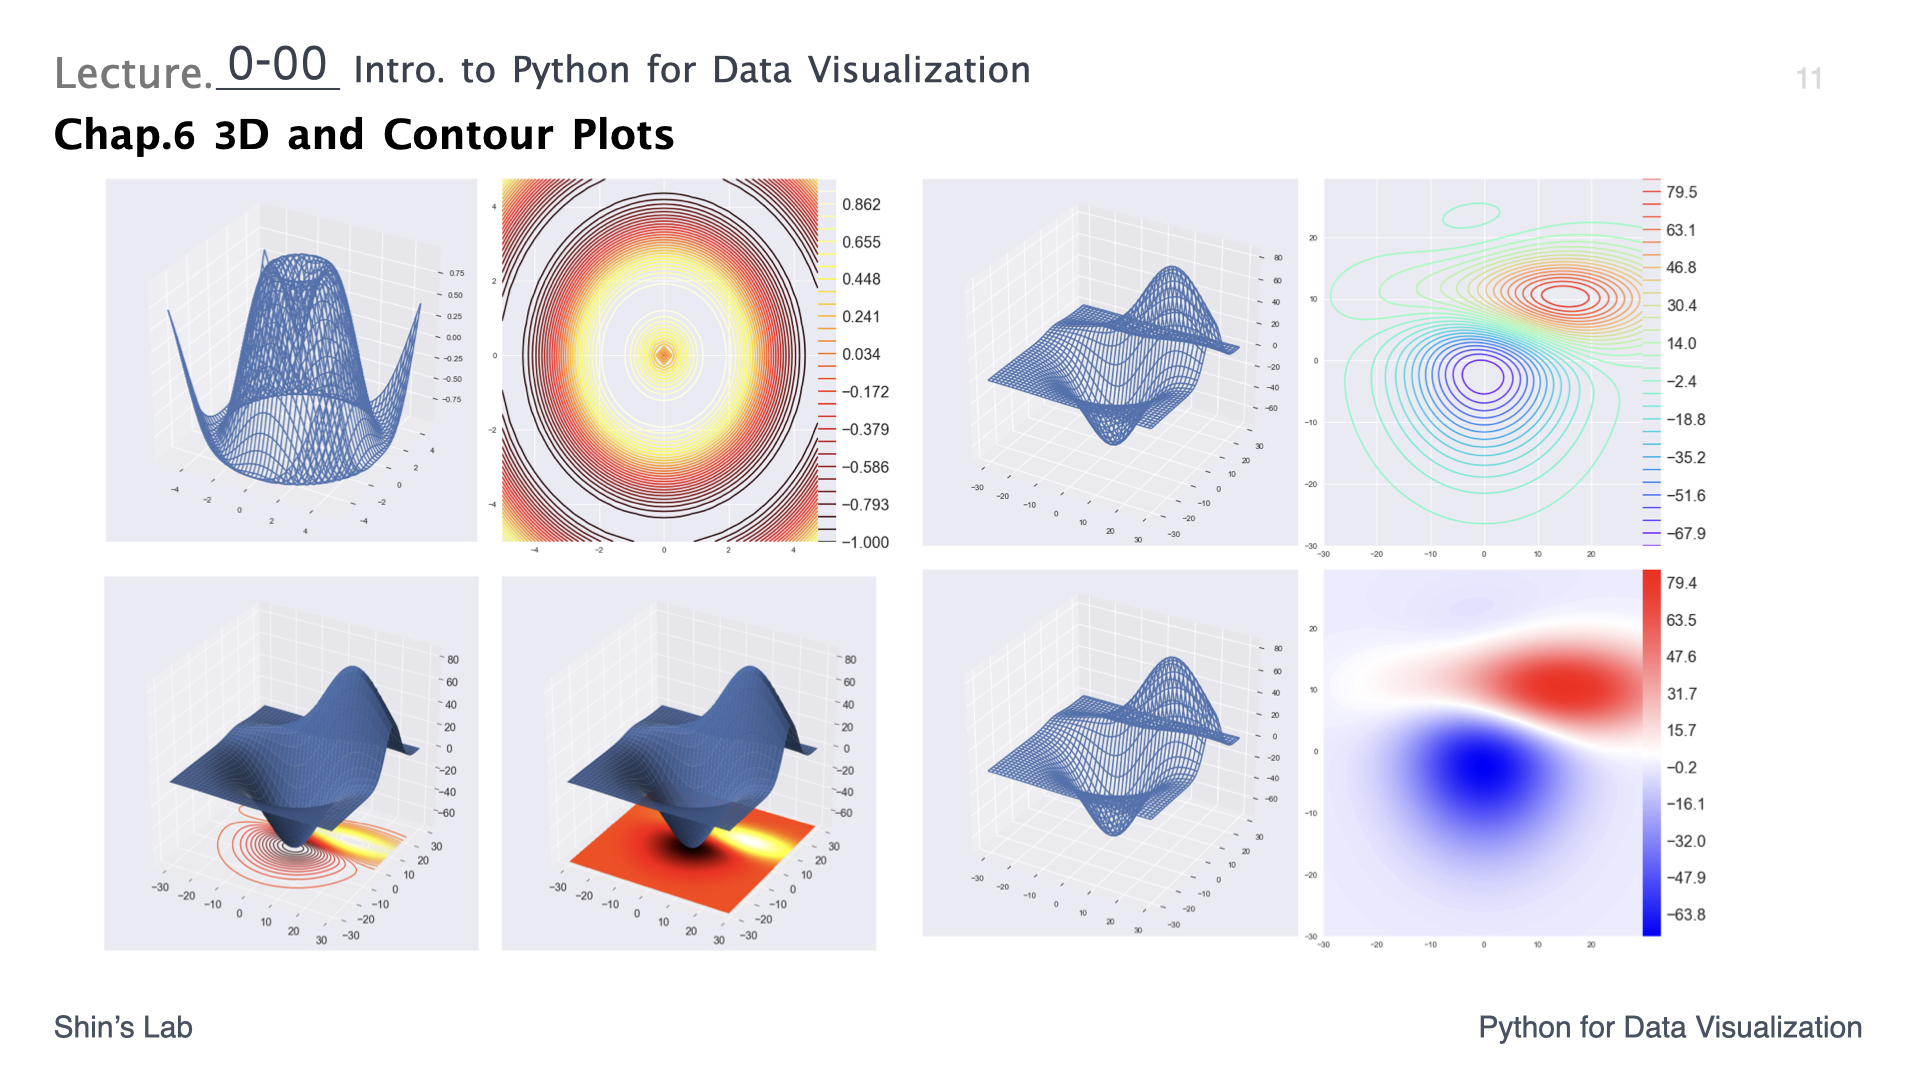
Chap.6 3D and Contour Plots
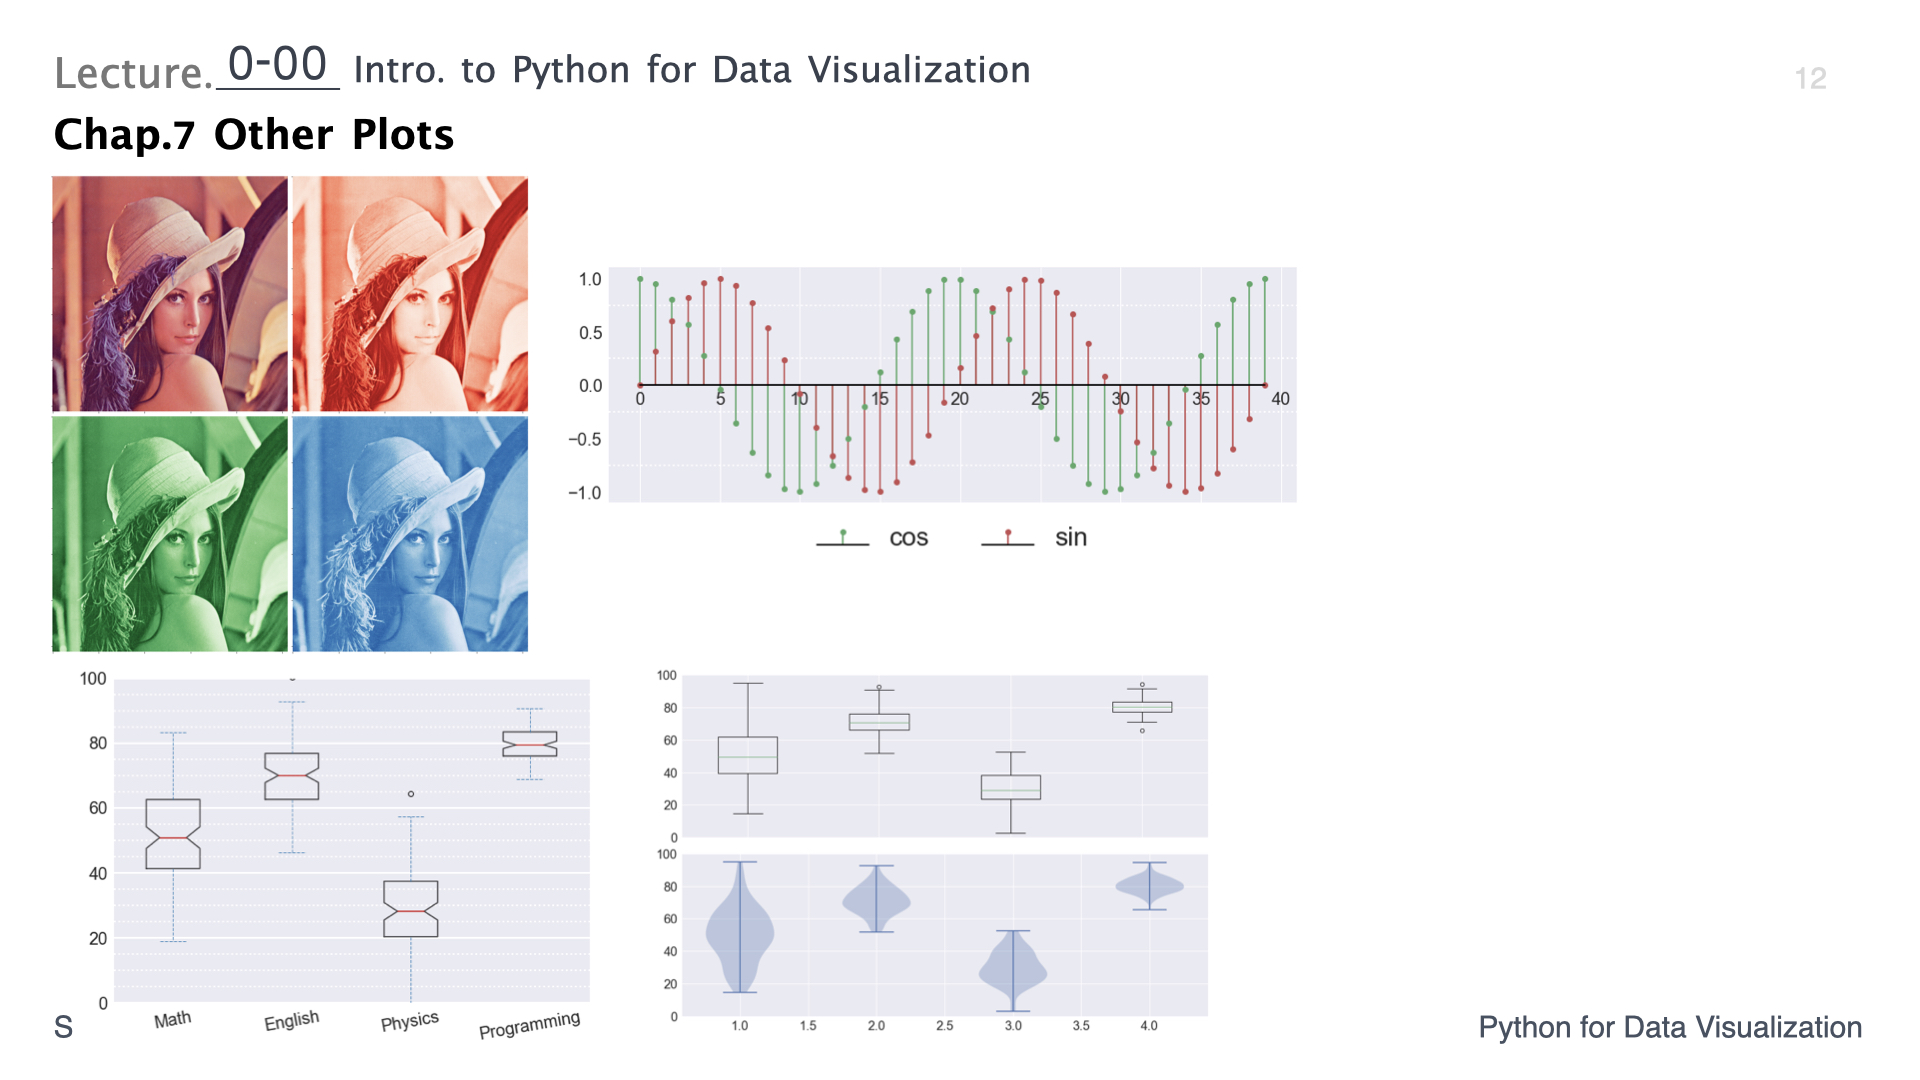
Chap.7 Other Plots (Imshow. Stem Plot, Box and Whisker Plot, Pie Plot,
Vector Field
위의 컨텐츠들을 충분히 익힌다면 수강생들은 실제 사용되는 대부분의 시각화를 다룰 수 있게 됩니다.
✔ Visualization Examples
- 강의에서 만드는 실제 시각화들은 다음과 같습니다.
커리큘럼 총 65강 · 15시간 43분
Chap.0 Intro to the Course
강의 목표와 강의의 특징에 대해 설명합니다.
ch0_Introduction_to_the_Course
14:03
Chap.1 Matplotlib Anatomy
Matplotlib을 이용한 모든 시각화에 통용되는 세부사항들에 대해 먼저 배움니다. 본 챕터는 Matplotlib을 이용해 데이터를 시각화하기 위한 튼튼한 뼈대를 만들 수 있습니다.
ch1_00 Intro to Matplotlib Anatomy
6:33
ch1_01_01 Making Figures and Axes(plt.figure, fig.add_subplot) 맛보기
28:11
ch1_01_02 Regular Axes Alignment(plt.subplots)
18:49
ch1_01_03 Irregular Axes Alignment(plt.subplot2grid)
13:26
ch1_01_04 Making Figure and Axes Practices
13:49
ch1_01_05 Arbitrary Locations and Sizes(fig.add_axes)
13:18
ch1_02_01 Axes Alignment Customizing(fig.tight_layout, fig.subplots_ad
18:48
ch1_02_02 Axes Alignment Customizing(Practice)
9:22
ch1_02_03 Axis Shaing(sharex, sharey)
24:40
ch1_02_04 Axis Shaing(Practice)
8:42
ch1_02_05 Twinx and Axis Scale
10:15
ch1_03_01 Titles and Labels(fig.suptitle, ax.set_title, ax.set_xlabel)
13:36
ch1_03_02 Text and Title Alignment
18:38
ch1_03_03 Text Properties and Font Dictionary
17:58
ch1_04_01 Tick Params and Ticks(ax.tick_params, ax.set_xticks)
19:16
ch1_04_02 Tick Labels and Practices(ax.set_xticklabels)
12:56
ch1_05_01 Grid System
18:10
ch1_06_01 Spine Objects
15:07
ch1_06_02 Spine Locations
15:17
ch1_07_01 Colors in Matplotlib
26:56
ch1_08_01 Matplotlib Styles and rcParams
9:57
Chap.2 Line Plots
Matplotlib을 이용하여 Line Plot을 그리는 방법과 실제 예제들을 다룹니다.
ch2_00 Intro to Line Plot
18:29
ch2_01_01 Line Plot Basics(ax.plot(y), ax.plot(x, y))
15:46
ch2_01_02 Several Line Plots and VH Lines(ax.axvline, ax.axhline)
15:02
ch2_02 Labels and Legends
14:12
ch2_03 Line Styles and Markers
12:57
ch2_04 Line Filling
8:27
ch2_05_01 Exercise1 and Exercise2
15:04
ch2_05_02 Exercise3
14:39
ch2_05_03 Exercise4 and Exercise5
15:08
ch2_05_04 Exercise6 and Exercise7
18:48
ch2_05_05 Exercise8
10:54
Chap.3 Scatter Plots
Matplotlib을 이용하여 Scatter Plot을 그리는 방법과 실제 예제들을 다룹니다.
ch3_00 Intro to Scatter Plot
6:41
ch3_01 Scatter Plot Basics
22:41
ch3_02 Advanced Markers and Legend
11:03
ch3_03 Size Legend
9:08
ch3_04_01 Exercise1 and Exercise2
21:45
ch3_04_02 Exercise3
15:34
Chap.4 Bar Plots
Matplotlib을 이용하여 Bar Plot을 그리는 방법과 실제 예제들을 다룹니다.
ch4_00 Intro to Bar Plot
4:03
ch4_01 Bar Plots Basics
16:38
ch4_02 Multiple Bar Plots
11:17
ch4_03 Rects Object
11:51
ch4_04 Horizontal Bar Plots
9:12
ch4_05_01 Exercise1 and Exercise2
17:52
ch4_05_02 Exercise3
16:23
ch4_05_03 Exercise4
17:13
Chap.5 Histograms
Matplotlib을 이용하여 Histogram을 그리는 방법과 실제 예제들을 다룹니다.
ch5_00 Intro to Histogram
6:37
ch5_01 Histogram Basics
13:52
ch5_02 Arguments of Histogram
16:28
ch5_03 Multiple Histograms
16:23
ch5_04 Histogram and Gaussian KDE
10:17
ch5_05 Exercises
15:27
Chap.6 3D and Contour Plots
Matplotlib을 이용하여 3D Plot과 Contour Plot을 그리는 방법들을 다룹니다.
ch6_00 Intro to 3D and Contour Plots
5:10
ch6_01 3D Figure and Axes
13:59
ch6_02 3D Plots with 1D Arrays
17:03
ch6_03 3D Plots with 2D Arrays
21:48
ch6_04 Contour Plots
18:14
ch6_05 Filled and 3D Contour Plots
13:10
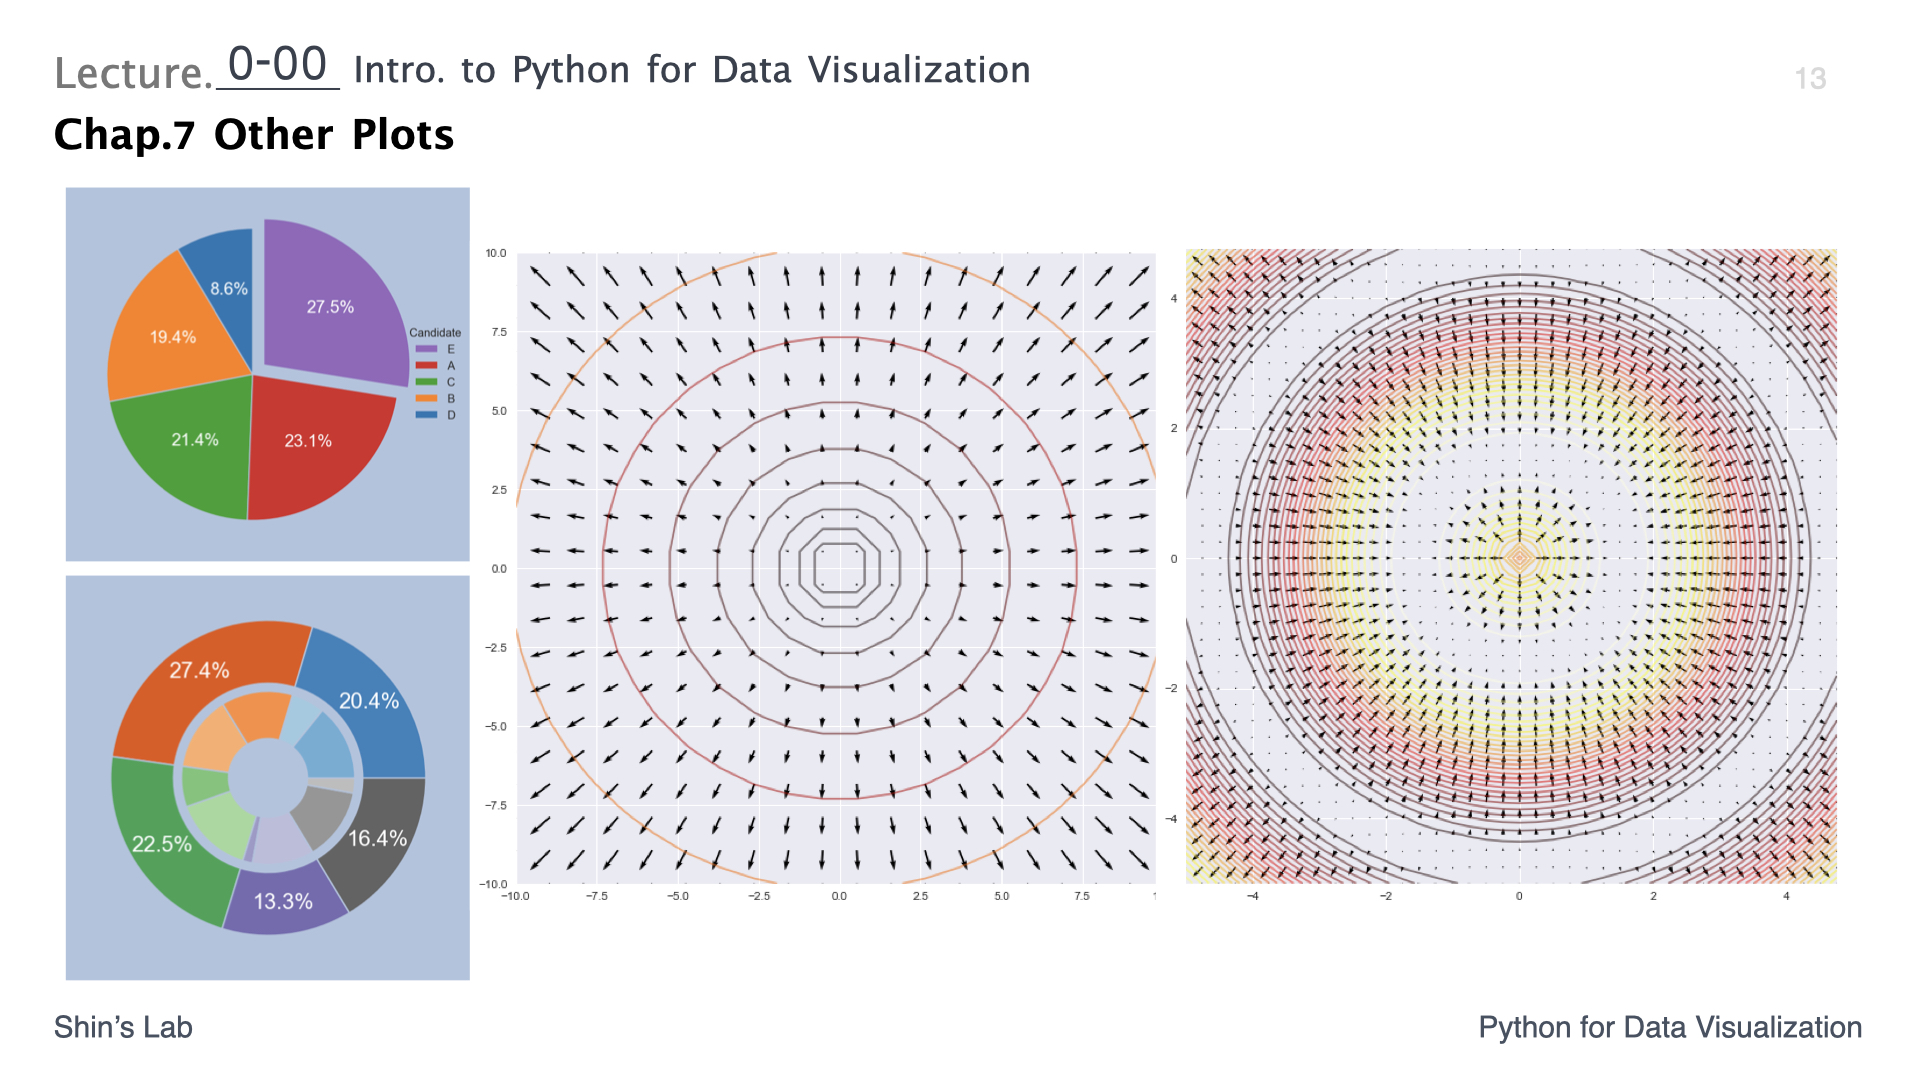
Chap.7 Other Plots
그 밖의 다양한 API들을 간단하게 다뤄봅니다.
ch7_01 Image Read and Show
19:02
ch7_02 Stem Plots
13:16
ch7_03 Box and Whisker Plots
13:53
ch7_04 Pie Plots
18:29
ch7_05 Vector Field Visualization
8:33
Chap.X Outro to the Course
강의를 마무리합니다.
Outro to the Course
2:56
참고자료총 7개
멘토 소개

신경식
공대형아의 데이터를 위한 파이썬
머신러닝과 딥러닝 프로젝트 진행 시 필요한 심도 있는 이해와 전문적인 기술을 가르쳐 드립니다. 입문 수준에 머무르지 않고, 인공지능 전문가로 만들어 드리겠습니다.
👨🏫[패스트캠퍼스] 수학적으로 접근하는 딥러닝 강의
🔥[유튜브] Shin's Lab 운영(수학, 신호처리, 머신러닝, 딥러닝)
👨🏫[패스트캠퍼스] 수학적으로 접근하는 딥러닝 강의
🔥[유튜브] Shin's Lab 운영(수학, 신호처리, 머신러닝, 딥러닝)
신경식의 다른 온라인 강좌는 어떠세요?


수강평 (2)
5점2
4점0
3점0
2점0
1점0

쏭정5년 전
꾸준히 수강 중입니다

최윤석4년 전
대부분의 내용을 수강했습니다
쏭정5년 전
꾸준히 수강 중입니다
최윤석4년 전
대부분의 내용을 수강했습니다